AI does the busywork. You do the research.
R runs the statistics and draws the figures. AI supports the analysis and the first draft. You focus on the question and what the results mean.
- Statistics run in R (survival, cmprsk)
- Manuscript numbers are checked against your results
- Patient data never leaves your device
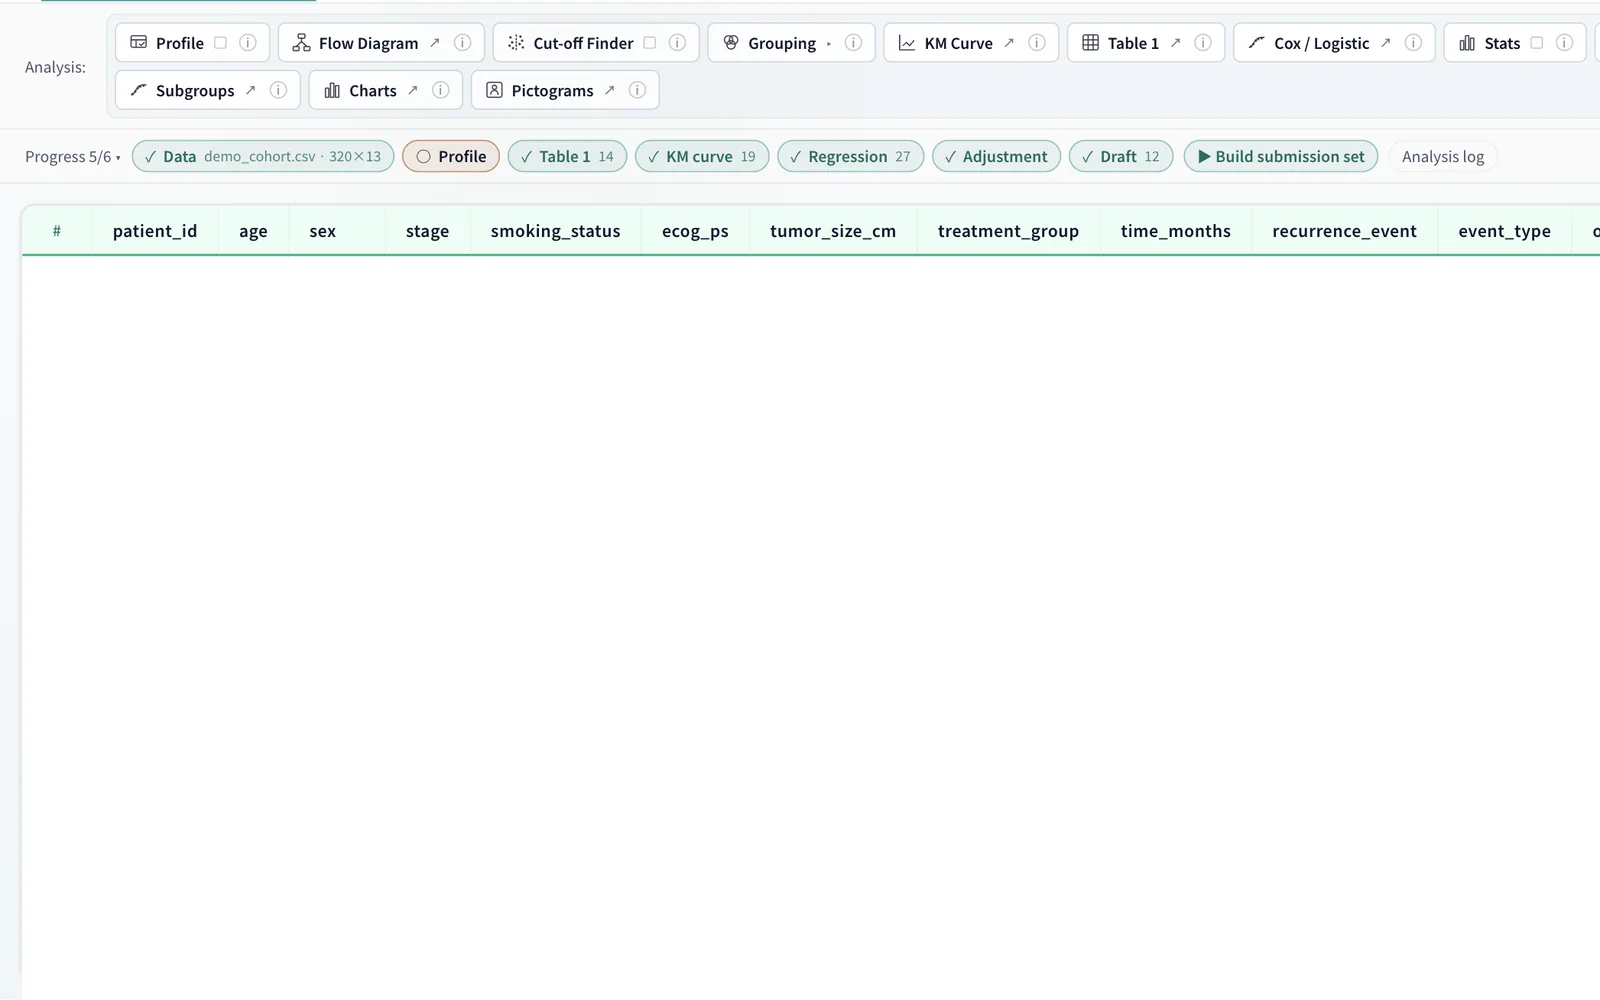
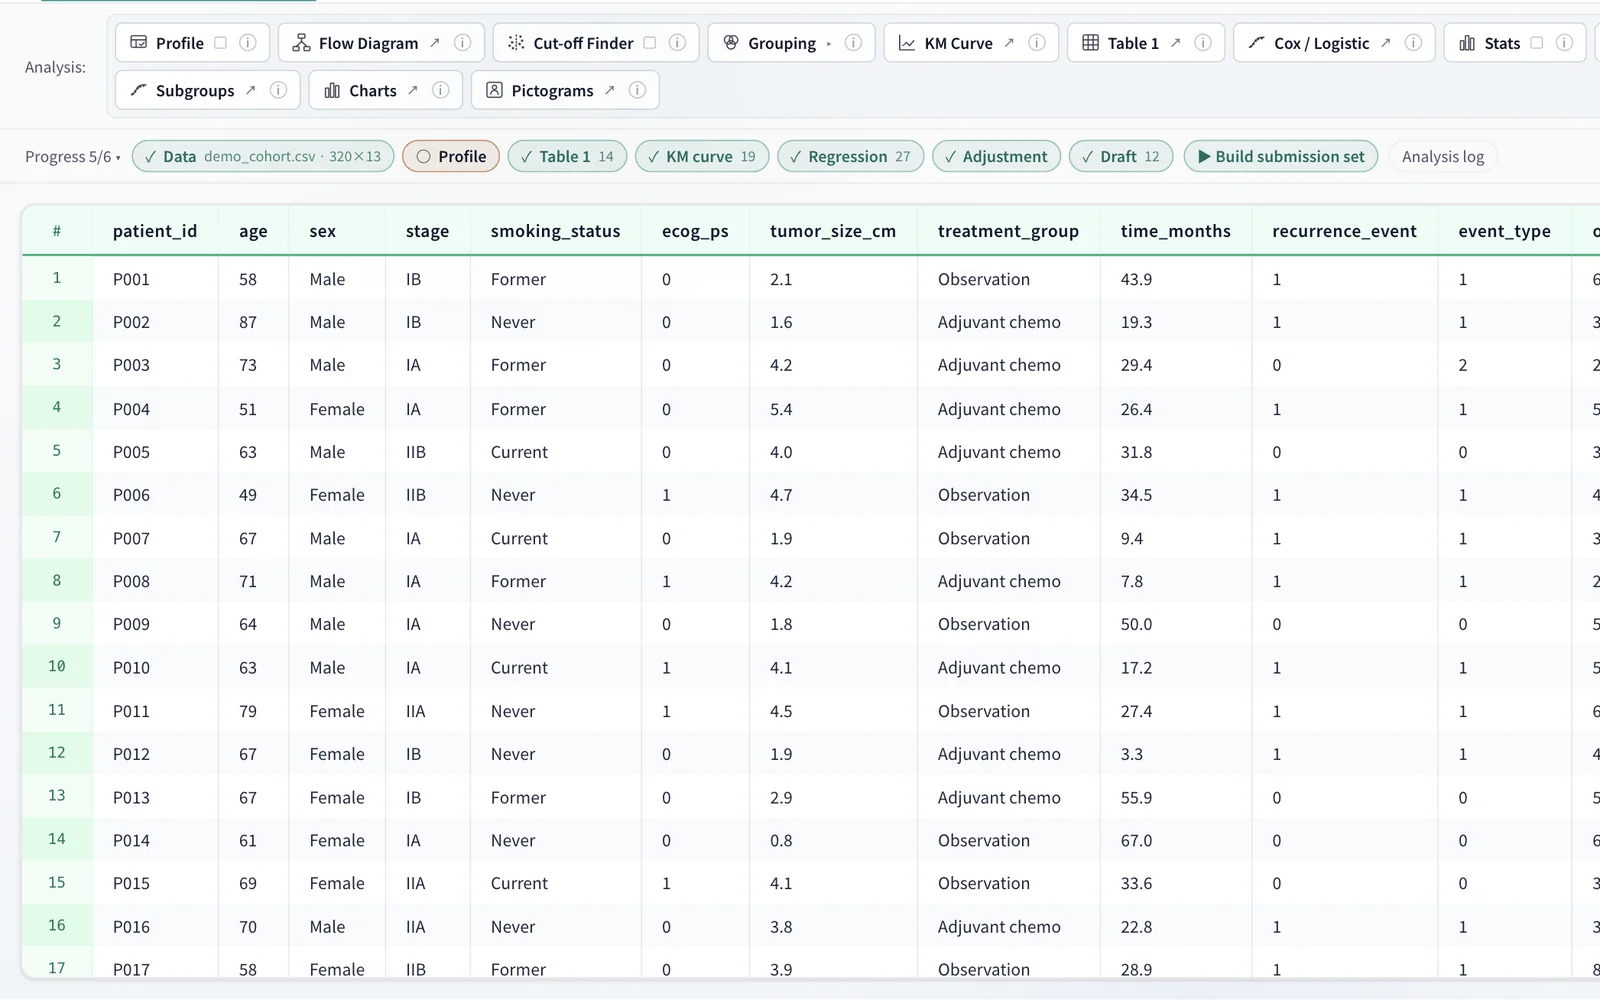
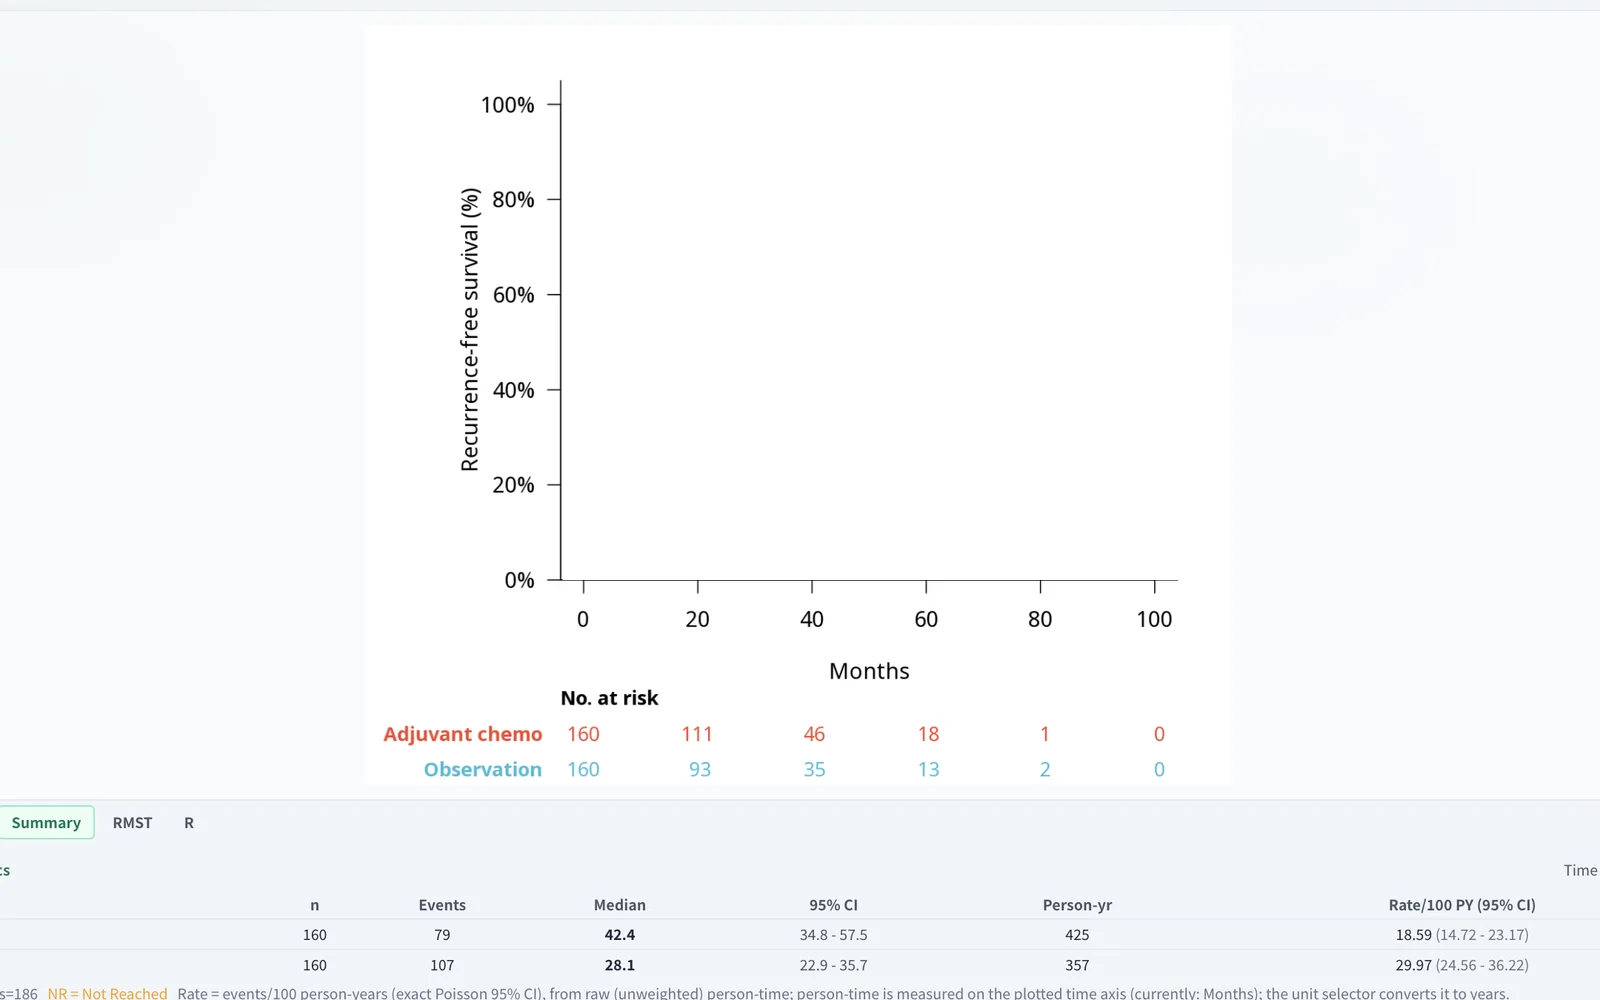
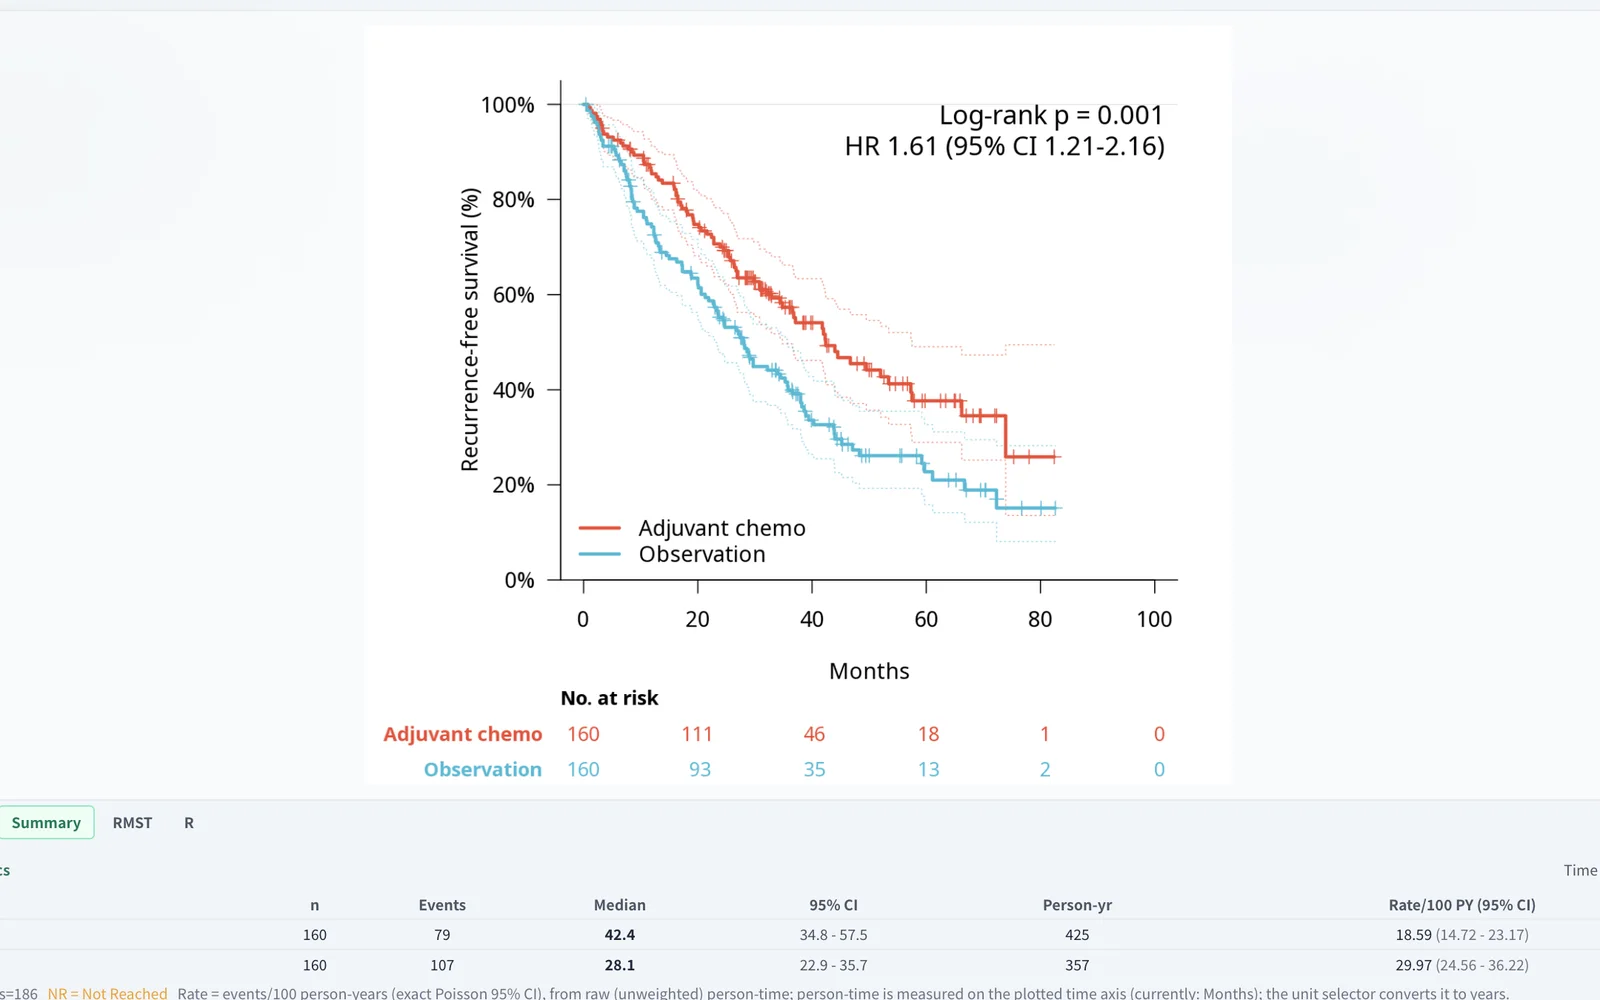

Just open a CSV — your data never leaves the browser.
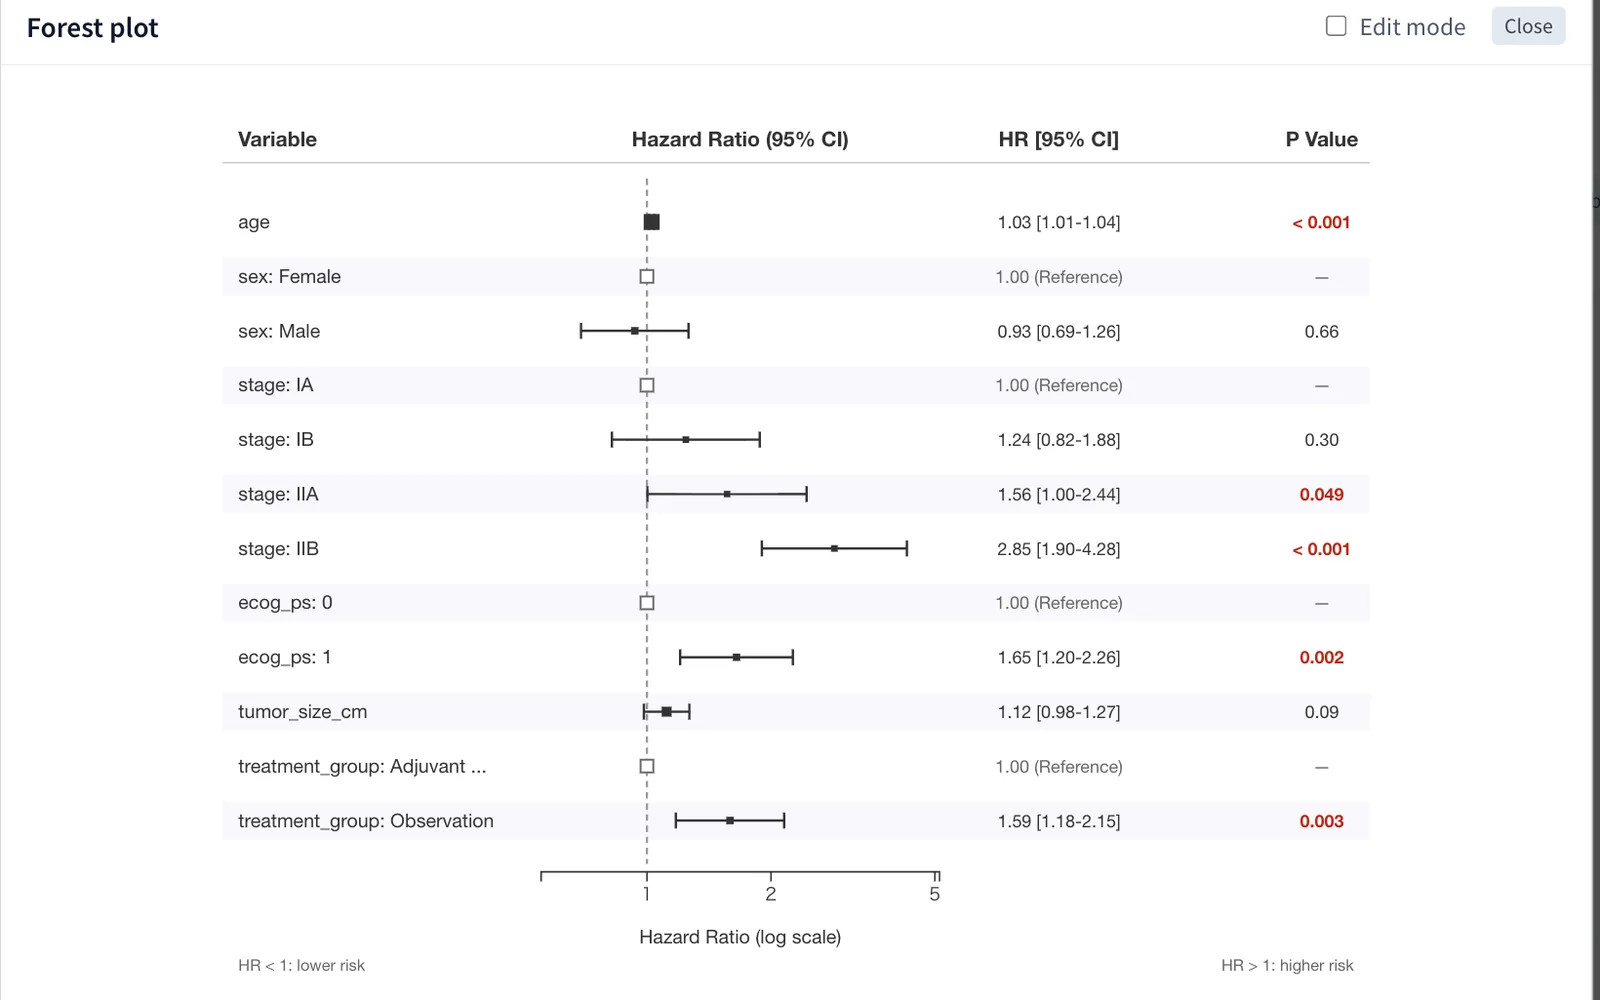
A demo of the RINKO.ai workspace, cycling through loading a CSV, running a Kaplan-Meier analysis, exporting a forest plot and drafting the manuscript. All values shown are fictional demo data.The problem RINKO.ai solves
You copy a number out of your stats software into a plotting tool. You read it off the figure and type it into the manuscript again. Every time, you stop to check whether you got it wrong somewhere. RINKO.ai removes that retyping.
- Stats softwareHR 1.61 (95% CI 1.21–2.16), p = 0.001retyped by hand
- Plotting toolHR 1.61 (95% CI 1.21–2.16), p = 0.001retyped by hand
- Manuscript…the hazard ratio was 1.61 (95% CI 1.21–2.16; p = 0.001)…
Figures and the manuscript use the numbers R computed, as they are.
Zero retyping — manuscript numbers checked against the results
From analysis to figures and drafts — inside the browser.
Your data never leaves the browser. R (webR) does the statistics in the browser and AI helps with analysis setup and manuscript drafts. Each demo is a straight recording of the real screens.
From analysis to manuscript, with AI alongside.
Analysis → figures → manuscript as one flow for clinical research. Open a CSV, describe the analysis in plain words, and go from confounder adjustment to publication figures and a Methods / Results draft — all in the browser. Patient data never leaves it.
- 01Data
- 02AI setup
- 03Analyze
- 04Adjust
- 05Figures
- 06AI draft
- 07Evolving
- 01Survival & competing risk
Survival curves, submission quality.
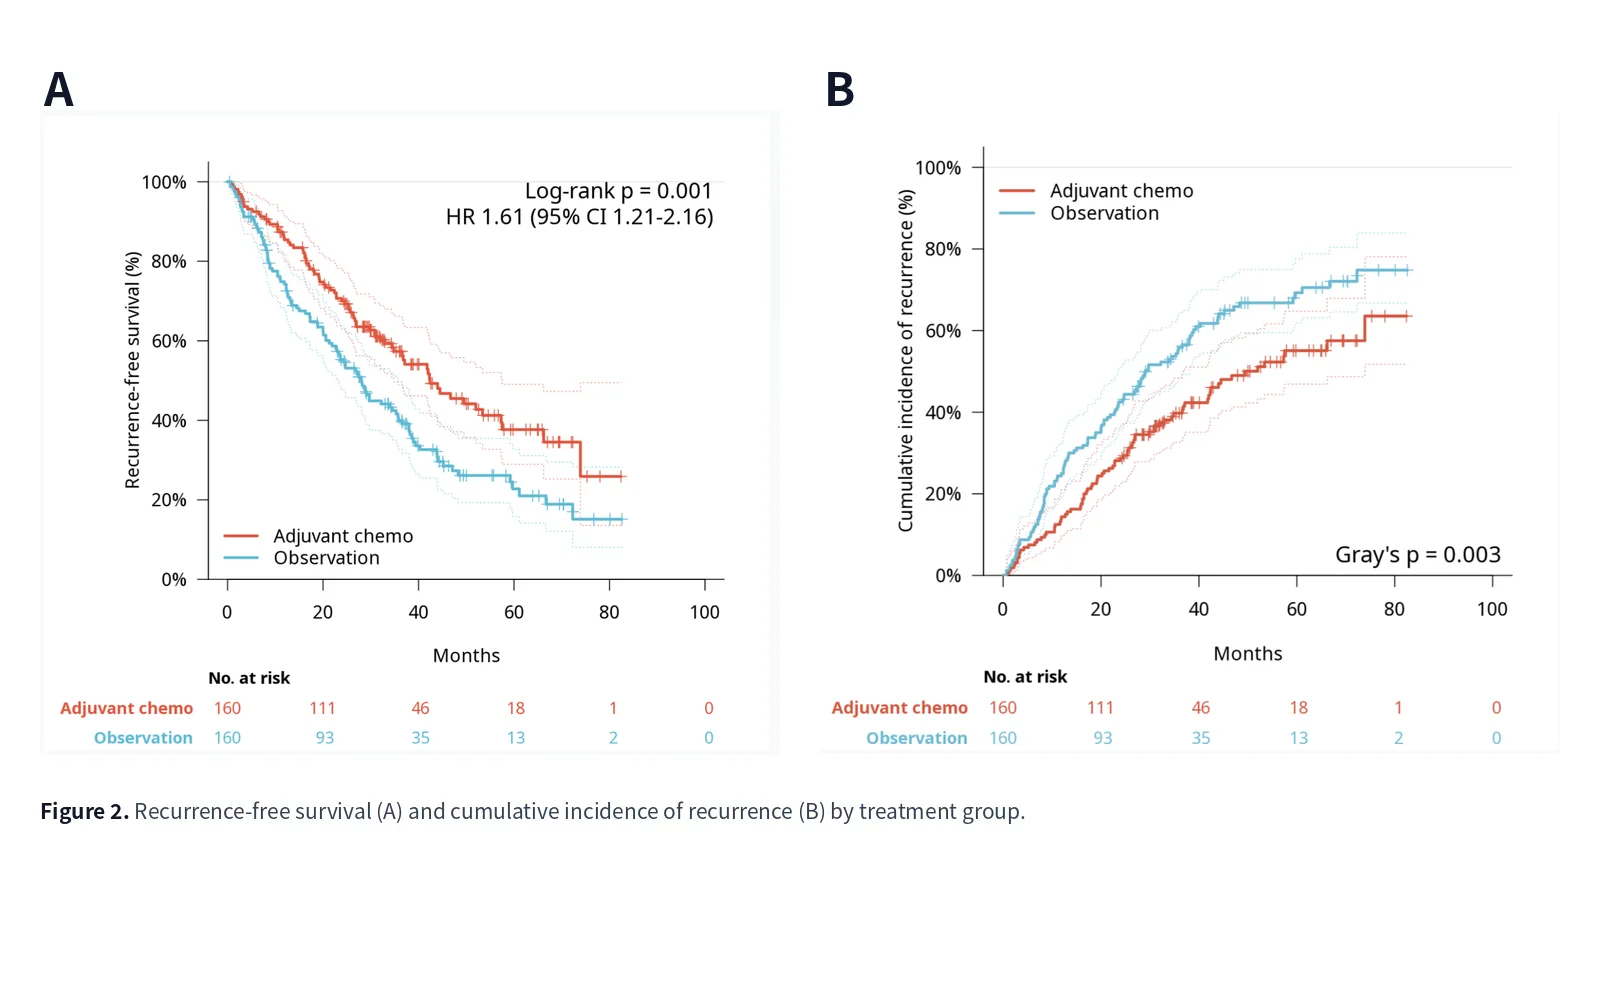
Kaplan-Meier curves, cumulative incidence for competing risks, and multi-panel figures. Pick the columns and draw — the risk table comes with it.
- Kaplan-Meier — risk table, log-rank test, HR with 95% CI inside the figure
- Competing risks as cumulative incidence (CIF) with Gray's test
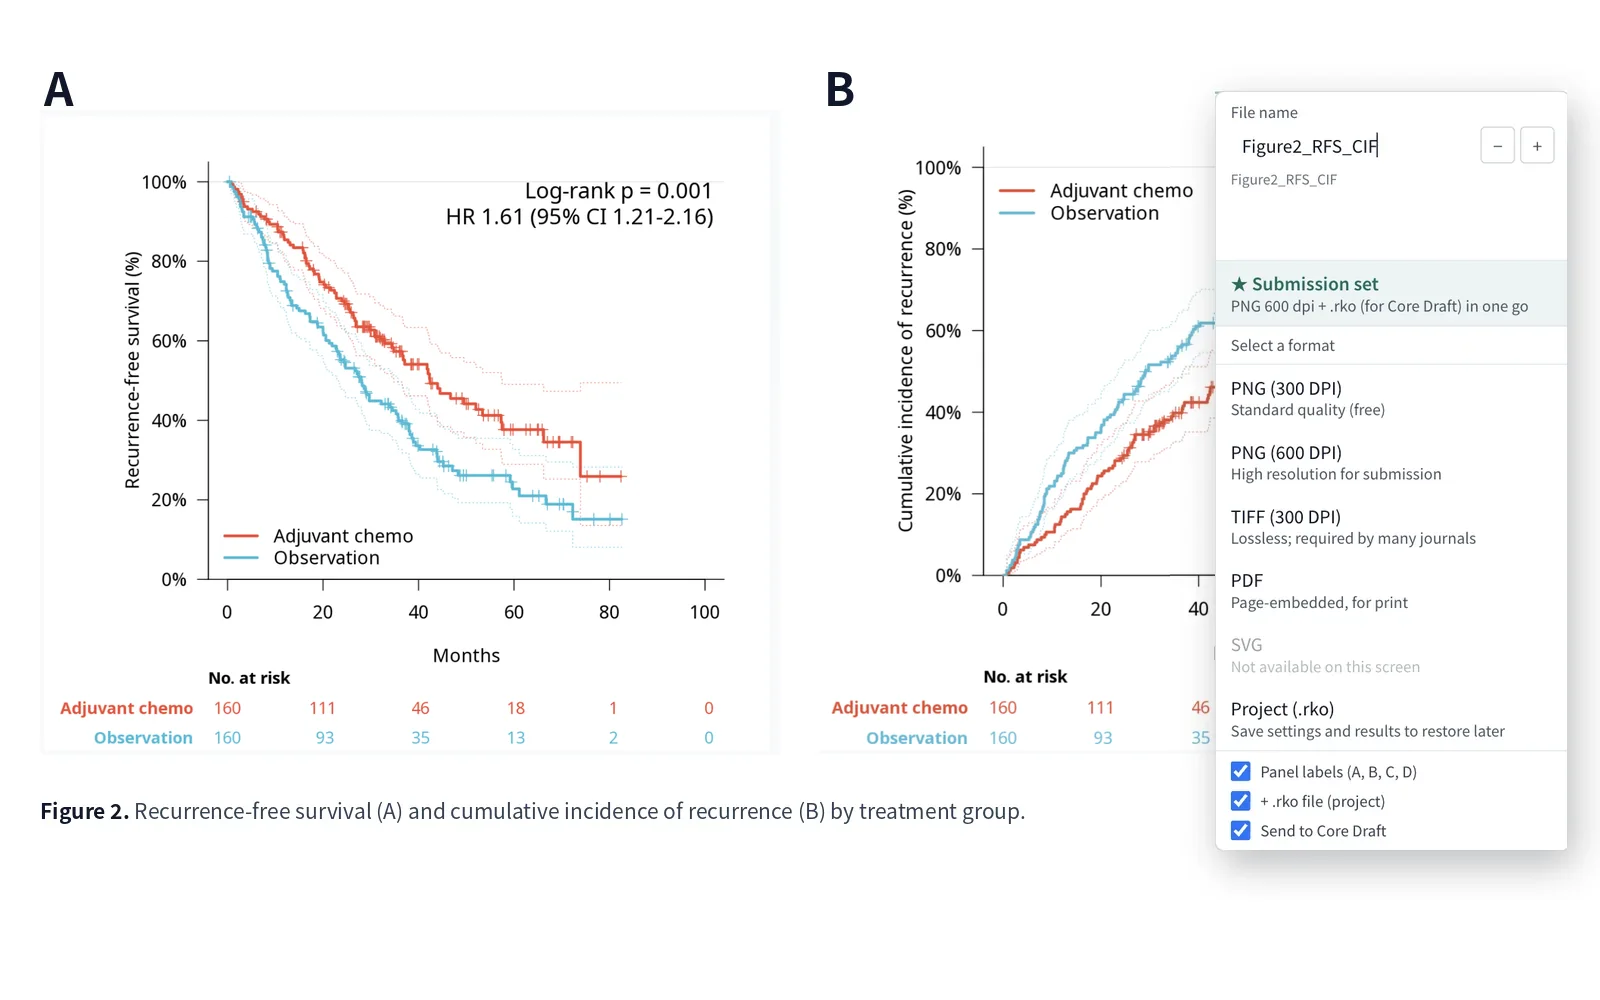
- Compose multi-panel figures (A / B / C / D) on one canvas with Figure Composer
- PNG 300 DPI is free; 600 DPI, TIFF, PDF and SVG are Pro
- 02Regression & adjustment
Confounder adjustment, in-browser R.
Multivariable Cox, Fine-Gray and logistic models as forest plots and tables, with propensity-score adjustment on the same screen.
- Univariable screening → multivariable model → forest plot in one pass
- HR, 95% CI and P at a glance; paste straight into Excel or Word
- Propensity scores — IPTW, matching or PS covariate; balance checked with SMD and a Love plot
- Warns on the spot about misleading results such as AUC < 0.5 or an unreached median
- 03AI draft
From setup to a verified draft, with AI.
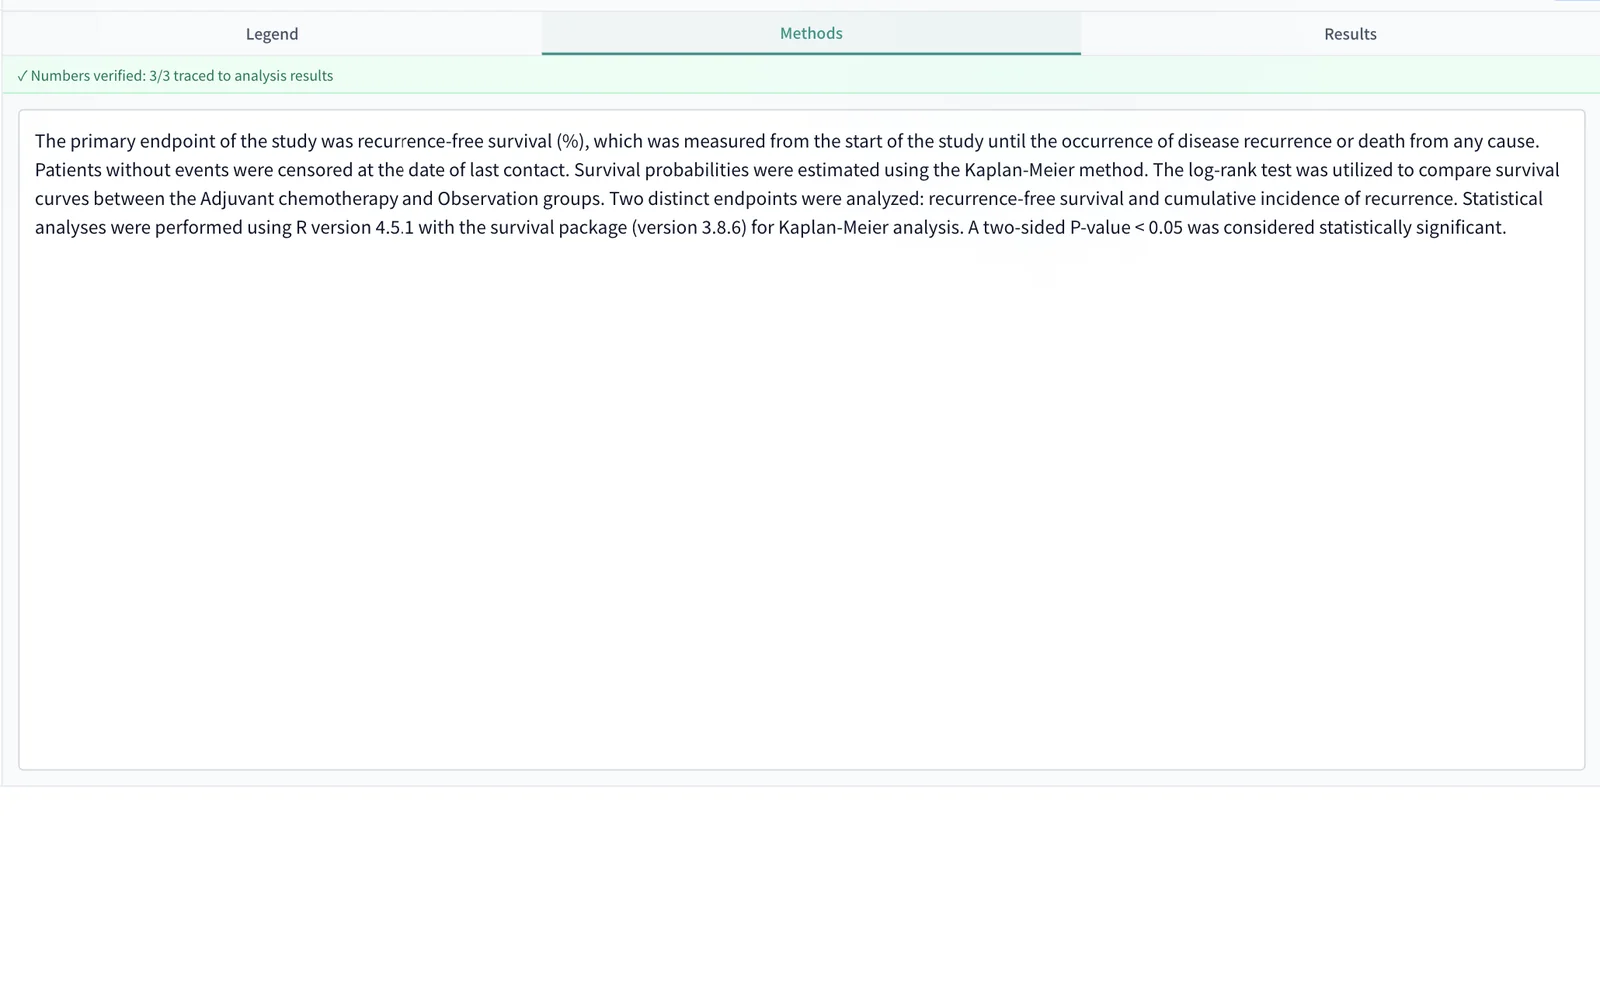
Describe the analysis you want and AI sets up the columns; then it drafts Methods and Results from your figures. AI never invents a number.
- “Compare recurrence-free survival between two arms and add a 60-month estimate” — say it, and it is set up
- Draft Methods / Results from your figures and keep them in Core Draft
- Every number in the draft is checked against your results and the count of verified figures is shown
- Pro only, credit-based — pay for what you use
Loading and computation waits are shortened. On a real machine they take a few seconds to a dozen.
How we keep it trustworthy
Build submission-ready figures yourself
R runs inside your browser, so you can analyse without writing code. Raw data, including patient information, never leaves your device.
- KM curves, forest plots, subgroups, charts, Table 1 and flow charts
- The R code that ran can be viewed and copied
- PNG free; SVG, PDF, TIFF and 600 DPI on Pro
The numbers are never invented
Methods and Results drafts are written straight from your analysis. The AI never guesses a number.
- One sentence of research question → column roles, target journal and planned outputs; refine by clicking
- Inconsistent values are detected and normalised on import, multi-level covariates are collapsed on proposal, and Cox models are health-checked as they are built
- Statistical review mode: comments as the journal's reviewer would write them, sensitivity analyses re-run in one click
- Figure visual QA: P values, legends and labels on the figure checked against the numbers, findings applied in one click
- Manuscript numbers are read from your results and verified; a full submission package matched to your journal
Pricing
Start free. No credit card required.
Free
- 10 credits/month = 5 figure exports
- KM curves, forest plots, Table 1
- Flow diagrams (CONSORT/STROBE)
- 282 pictograms (SVG/PNG) — unlimited, no sign-in
- AI drafting is on Pro
Pro
$12.4/mo with yearly billing
- 500 credits/month = about 2 full drafts
- AI-generated Methods, Results & full submission drafts
- Vector & high-DPI export (SVG / PDF / TIFF, 600 DPI)
- AI analysis setup (auto column mapping)
A figure export costs 2 credits. An AI-drafted section costs 20–50.
Receipts / invoices (PDF) can be downloaded any time from Settings (billing name editable). Contact us for quotes or bank transfer.
Latest updates
- New
Three guards for a correct analysis: value normalisation, collapsing multi-level covariates, and a Cox model health check
A batch-generated Cox model on real data turned out to have the exposure (group) missing from the model, a 13-level factor full of inestimable levels, and a reference level with one patient. These three problems occur in every field, so RINKO.ai now stops them at the door.
- Improved
KM settings are remembered; figure-QA findings write themselves back (axis titles, Sankey labels, X max)
KM screen settings now persist in the browser: the X-axis title per time column, the Y-axis title per event column, and the look (font, at-risk table, confidence bands, P-value position) per user. They are reused the next time you open the screen and when the submission batch regenerates the figure.
- New
Statistical review mode and figure visual QA: an AI reviewer before you submit
Two buttons were added to the progress board. Statistical review reads your recipe (column roles), the automatic checks (events per variable, proportional-hazards test, VIF, events per group, missingness) and the numbers of the saved analyses (Table 1, KM, Cox, forest plot, propensity-score balance) as the target journal's statistical reviewer would, and returns a Japanese summary with English reviewer comments, a concrete fix and the evidence for each comment, suggested sensitivity analyses (competing risks, a different covariate set, OS instead of RFS, PSM/IPTW, E-value, cut-off exploration) and a draft 'Sensitivity analyses' paragraph for Methods. Each suggestion has a Run button: the recipe is changed for that run only, the Table 1 / KM / Cox batch runs, and the recipe is restored afterwards (results are saved as sens_… and never mixed with the main analysis). Figure QA shows the latest figure of each kind (KM, Figure Composer, forest, flow diagram, chart) to the AI as an image and compares it with the numbers in its own .rko: P values, n and risk-table counts printed on the figure, axis titles and units, legend labels vs group labels and raw codes, clipped or overlapping text, pixel size against the journal's dpi requirement, and consistency across figures. Neither sends row data (review 40–80 credits; figure QA 15–30 credits per figure).
Write your next paper with RINKO.ai.
Signing up takes a minute. No credit card needed.
AI output is a draft. Always review it yourself before submission.